On the morning of Wednesday, Nov. 6th, Americans awoke to the news that former President Donald Trump is the projected winner of the 2024 presidential election. Trump won the popular vote at about 50.5% and is likely to be elected via the electoral college in December with 312 votes, according to The Associated Press.
Democratic candidate Vice President Harris conceded late Wednesday afternoon with a televised speech from Howard University in Washington, D.C. where she committed to a peaceful transfer of power, but also stated that “while I concede this election, I do not concede the fight that fueled this campaign.”
During this historic moment, The Dolphin decided to survey Le Moyne students on their reaction to the election results. From Nov. 6-8, students were welcome to express their opinions in a Google form. Although students had to submit their answers through their school Google account to ensure that one response was submitted per student, their names and emails were not recorded, so all responses remained completely anonymous. This was done to encourage students to speak as candidly as possible.
The survey includes questions about students’ reactions to the results, as well as questions about their voting decisions. The survey received responses from 141 students, 132 of which voted in the election, and 9 of which did not. This sample population accounts for about 4.5% of the student body.
Initial Reactions & Expectations
All respondents were asked for their initial reaction upon learning the results on Wednesday morning.
About 63% of respondents used negative language in their responses to express their dismay, whereas 23.4% used positive language to express their joy. 13.4% of respondents used neutral language, saying only that they were shocked/surprised, felt indifferent, or had predicted the outcome.
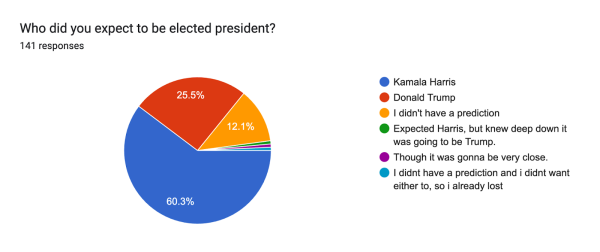
Additionally, 60% of respondents expected Harris to win, with 25.5% believing in Trump and about 12% having no prediction at all. This leaves the majority of respondents (about 74.5%) who did not predict a winner or did not predict correctly.
To Fear or Not to Fear
The first part of the survey also asked the question “Do the results make you fear for your wellbeing/rights? Why or why not?” 32% of respondents say no, 56% say yes, and 9% state that while they are not scared for themselves, they are scared for others.
Some cite Trump’s previous administration as proof that fears are unfounded, while others blame the media for fueling voters’ fears. There are also those who argue on behalf of Trump improving the economy and/or border control making them feel more secure, and multiple women who express their disbelief in the idea that Trump’s administration is dangerous for them.
Multiple respondents also shared that they are glad to live in New York State, which just passed Proposal Number One, an amendment that protects equal protection rights.
Many of those who do fear for their rights in the face of a second Trump administration cited their personal identity as being a main reason. Of those who expressed fear, 40.5% mentioned being a woman/female, 25% cited being LGBTQ+, 7% mentioned being people of color, 3.7% discussed being first generation or having immigrant families, and 2.5% cited being disabled.
Respondents also discussed Trump’s character, fearing for the country on account of Trump’s planned policies in Project 2025, his status as a convicted felon, and challenging his self-absorbed personality. Others mentioned not feeling afraid for themselves, but fearing for others who would be affected by conservative policies.
Finally, there were respondents whose answers are not a clear yes or no, with one stating “I don’t even know anymore,” and another sharing, “Not necessarily, because when have my rights ever been respected in the history of this country? America is going to continue to go backward to the point that nothing else matters any more. ‘Make America great again’ my ass.”
How Did Le Moyne Vote?
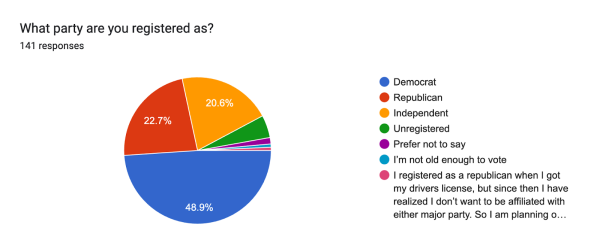
Additionally, respondents were asked what party they were registered as. The largest group are registered democrats at 48.9%, with republicans at 22.7%, and independents at 20.6%. 5% claim to be unregistered, possibly due to being underage or non-US citizens, and 1.4% prefer not to say.
One respondent specifically shared this in response to the party question: “I registered as a republican when I got my drivers license, but since then I have realized I don’t want to be affiliated with either major party. So I am planning on switching to independent.”
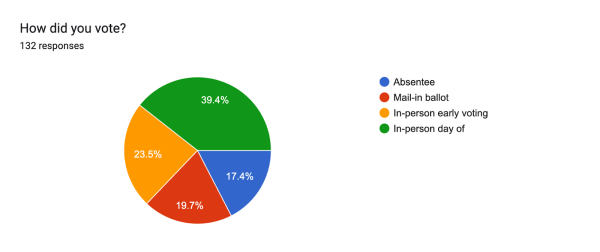
The group of respondents who indicated that they had voted were asked what method of voting they used. It is interesting to note that while about 40% of respondents did vote in-person on election day, the majority (60.6%) of the respondents chose non-typical voting methods such as early voting, absentee voting, and using a mail-in ballots.
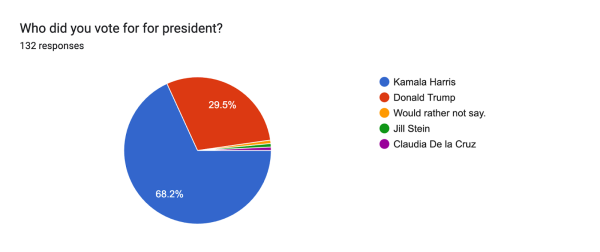
Of those who did vote, it appears that the Le Moyne population’s votes do not reflect the national election results. 68.2% of the respondents reported that they voted for Harris, while 29.5% voted for Trump. Additionally, there were two students who voted for third-party candidates, and one that declined to answer.
Onondaga County favored Harris, as well, earning 57.5% of the vote as opposed to Trump’s 41.26% according to syracuse.com. It appears then that this sample of Le Moyne’s population tends to lean more left than Onondaga County, as 10.7% more of respondents voted for Harris than residents of the county.
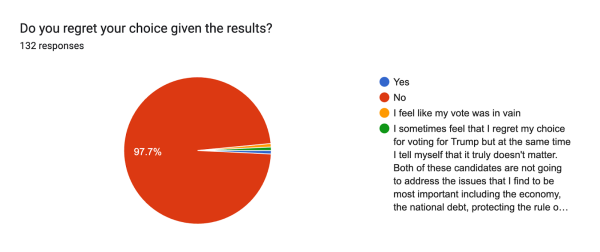
Nearly all of the respondents cited that they did not regret their vote given the outcome, with only one selecting “yes,” and another sharing that they felt their “vote was in vain.”
In response to this question, one respondent shared their mixed feelings: “I sometimes feel that I regret my choice for voting for Trump but at the same time I tell myself that it truly doesn’t matter. Both of these candidates are not going to address the issues that I find to be most important including the economy, the national debt, protecting the rule of law, fighting climate change, and protecting life from conception to one’s natural death.”
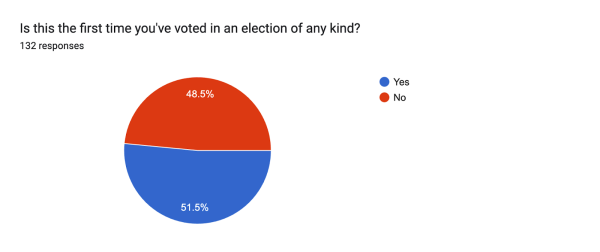
Respondents were also asked if this was the first election they were voting in, a near 50-50 with 51.5% having voted before, and 48.5% having not.
When asked their reasoning, about 69% reported having been previously too young and 7% claimed prior ineligibility without specifying the reason. 12.5% of these new voters claimed they had previously been uneducated or that this election was particularly important; here is what they had to say:
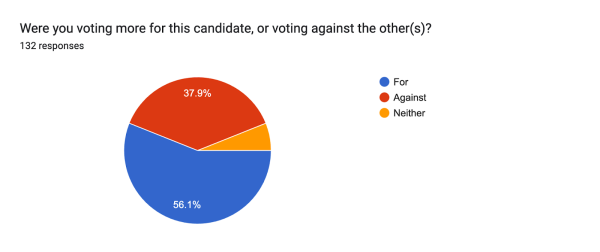
All voters were asked whether they felt that they were voting more for their candidate or against the other. About 56% of respondents cited that they were for their candidate, while about 38% were against. Additionally, about 6% of respondents chose “neither.”
55.5% of Harris voters said they were voting for her, with 41% against Trump, and 3% selecting “neither.” Alternatively, 61.5% of Trump voters cited that they were voting for him, 28% were against Harris, and 7% selected “neither.”
Harris Voters
Harris voters, when asked why they chose her split into a few different groups.
35.5% stated Trump as being the main reason, and about 8% of Harris voters said they were choosing from a lesser of two evils. Multiple respondents freely admitted to Harris not being perfect or even ideal, but being more afraid of Trump being restored to power.
There were many respondents who did believe in Harris as a candidate, though. 26.6% of Harris voters cited their faith in the Vice President’s character and policies. Many expressed that they trusted Harris on the policies that matter to them: 22% of respondents mentioned civil rights issues having to do with minority groups, while 21% cited women’s rights explicitly or expressed wanting to see Harris as the first female president. 14% of respondents alluded to believing Harris to be more progressive, paving the way for a brighter future, while 10% cited the economy, 9% her qualifications, 8% the environment, and 8% safety.
Trump Voters
Trump voters had a plethora of reasons for re-electing the former president.
Some criticize Harris and her agenda, with 38% of Trump voters cited Harris as a major reason they voted for him, and 13% of responses mentioning Biden or the Biden administration.
Alternatively, plenty of respondents also discussed electing Trump for his character and 48.7% of Trump voters mentioned the economy as being one of their main reasons, while 25.6% discussed border policy, 18% indicated Trump’s stance on abortion, 13% cited religious reasons, and 5% because of anti-transgender views.
Outliers
Then, there were two students who decided to vote third party, feeling dissatisfied with choosing between Harris and Trump.
One voted for Claudia De la Cruz, who is part of the Party for Socialism and Liberation. The respondent explains that they voted for De la Cruz “[b]ecause she isnt funding and unconditionally supporting a genocide, and isnt going to enact right wing policies that hurt Americans and Non-americans alike.”
The other voted for Jill Stein of the Green Party. Their reasoning was that she “ran on an anti-genocide, pro-education, and pro-environmental platform. I knew that Kamala Harris would win New York, so I had no obligation to vote for her.”
There was one respondent who chose not to share who they voted for, stating that they “picked the lesser of two evils.”
Non-Voters
The students who did not vote were asked for their reasoning. A few explained that they could not vote because they were not yet 18 or were not a US citizen. On the other hand, there were those who made the active choice not to vote because of dissatisfaction with the options presented or feeling that their vote would not contribute.
Conclusion
At the end of the survey, respondents were asked if they had anything else they wanted to share, and many took this as an opportunity to share their unfiltered thoughts on both the election results and people’s reactions to them.

